
|
|
|||
|
A pdf version of the editorial can be obtained from
here
Department of Biomedical Physics, Institute of Experimental Physics, Warsaw University, ul. Hoza 69, 00-681 Warszawa, Poland
Wieslaw Konopka Department of Otolaryngology, Medical University, ul. Zeromskiego 113, 90-549 Lodz, Poland
Antoni Grzanka Institute of Electronic Systems, Warsaw University of Technology, ul. Nowowiejska 15/19, 00-665 Warszawa, Poland Independent Laboratory of Prevention of Environmental Hazards, Medical University, ul. Zwirki i Wigury 61, 02-091 Warszawa, Poland
Click evoked otoacoustic emissions (OAE) and a set of tone bursts OAE, covering the same frequency band, were recorded and decomposed into the basic waveforms by means of high- resolution adaptive time-frequency approximation method based on Matching Pursuit algorithm. The method allows for description of the signal components in terms of frequencies, time occurrences, time-spans and energy. Resonant modes characteristic for given subject/ear, were identified. They were characterized not only by the close frequencies appearing for different tones, but they had usually similar latencies and time spans. Short time and long time resonant modes were identified. The second ones might be possibly connected with spontaneous emissions. The method opens a new perspectives in studying the fine structure of the OAE and testing of the theoretical models.
I. INTRODUCTION
The mechanisms of generation of otoacoustic emissions (OAE) are still a matter of a debate. In particular it concerns the role of linear and non-linear effects in shaping the structure of the OAE signal. Spontaneous OAE (SOAE) as well as evoked OAE (EOAE) exhibit periodic variations in amplitude and phase with frequency, which are called ?fine structure?. Early attempts to describe cochlear OAE fine structure were based on the assumption that they originated from nonlinear reflection (e.g. review by Shera and Guinan, 1999). However there are also models, which consider linear cochlear reflection as a main source of cochlear fine structure. These models involve the presence of low level inhomogeneities strewn along cochlea (Shera and Zweig 1993, Zweig and Shera 1995, Talmadge et al. 2000). In order to resolve the debate, the test of the models based on the precise analysis of the experimental data is needed. In particular the study of the fine structure of OAE calls for a method, which will have capability of decomposing the signal into basic components of well defined time-frequency characteristics. This work presents such method based on adaptive approximations, which has time-frequency resolution superior to the other methods currently applied for OAE studies and at the same time offers parametric description of the signal components. One of the parameters important for testing the models is the latency of frequency components. In the recent studies continuous wavelet transform (WT) (Tognola et al.1997) or discrete WT (Sisto and Moleti, 2002) were used. The method proposed by us the Matching Pursuit (MP), is free of the limitation of WT, which binds inversely time and frequency bands, moreover the MP method makes possible the decomposition of the OAE signal into its basic components described by means of well defined frequencies, latencies, amplitudes, and time spans. In this paper we shall first describe the method and demonstrate its performance by means of simulations. The comparison with other methods of time-frequency analysis will be shown. Then we will apply MP to the click and tone evoked OAE. We shall compare the time-frequency distributions obtained for click-evoked OAE with the superposition of the tone generated OAE, with the aim of testing for the linearity of the response. Finally we shall construct the frequency-latency curve and fit the function representing this relation.
II. METHOD
A. Experimental procedures
Otoacoustic emissions were recorded using ILO 292 Echoport system designed by Otodynamics. Dataset consisted of the OAE recordings from 12 young (20-25 years) adult men. All subjects were laryngologically healthy without any otoscopic changes in ears. Impedance audiometry tests for all subjects were performed. Type A tympanograms were recorded with correct reflex from stapedius muscle. In pure tone audiometry hearing threshold was 10-15 dB. Responses to 260 repetitions of stimuli were averaged with the nonlinear mode of stimulation. Intensity of stimuli was kept on level of 65-68 dB. Click evoked otoacoustic emissions and a set of tone-bursts OAE were measured for each subject/ear. The tone-burst with central frequencies of: 1000, 1414, 2000, 2828, 4000 Hz and of half octave bands were used. These stimuli were constructed to cover the same frequency band (840 to 4757 Hz) as the click stimulus.
B. Data analysis method
Matching Pursuit (MP) algorithm was introduced by Mallat and Zhang (1993) and first applied to physiological signal processing by Blinowska and Durka (1994). The method is based on the decomposition of the signal into basic waveforms (called also atoms) from a very large and redundant dictionary of functions. Finding an optimal approximation of signal by selecting functions from very large and redundant set is a computationally intractable problem, therefore the sub-optimal solutions are applied. The waveforms are fitted in the iterative procedure, starting with the atom giving the highest product with the signal, which means that it accounts for the largest part of the signal energy. Then the next atoms are fitted to the residues. We used the dictionary of Gabor functions, given by the formula:
The components of the signal are described by parameters: w- frequency, u- latency, s- time
spread, The method is very robust in respect to noise. The addition of noise with variance twice bigger than the variance of the signal does not influence critically the time-frequency positions of waveforms corresponding to simulated structures, only some spurious waveforms are added (Blinowska and Durka 2001). The advantages of the method were demonstrated in the EEG studies e.g.: for extraction of specific structures from the signal (Zygierewicz et al. 1999) and for revealing microstructure of event related responses (Durka et al. 2001). The tutorial concerning MP method and MP software are available at http://eeg.pl .
III. RESULTS
A. Simulations
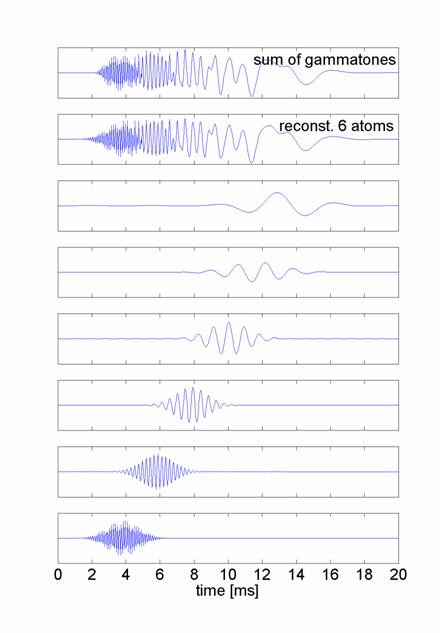
In order to demonstrate the properties of the MP algorithm and to compare it with other methods used for the evaluation of the OAE signals we have performed simulations based on the signals resembling OAE. Components of OAE were represented by gammatones, since it is commonly assumed that they reproduce the shape of click evoked OAE at single resonant frequency. We have constructed the test signal consisting of 6 gammatones with frequencies: 280, 550, 1100, 2200, 4400, 8800 Hz and spaced 2 ms in time. In Fig. 1 the decomposition of this signal by means of the MP algorithm into the 6 atoms of highest energy is shown, together with the signal reconstructed from these atoms. Correlation coefficient between the reconstructed and original signal is 0.98. The rest of the energy of the original signal is accounted by the next atoms found in the iterative procedure. They describe the details of the shape of the gammatones, however their contribution to the total energy of the signal is small. We can see that the positions of the strongest atoms coincide with the maxima of the gamma bursts and the basic waveforms well reproduce the components of the simulated signal. Therefore we can accept the centers of the atoms found by MP as the latencies of OAE components connected with ?group velocities?.
Fig. 1. From the top: the simulated signal ? sum of six gammatones of frequencies 280, 550, 1100, 2200, 4400, 8800 Hz, the reconstruction of the signal from the first 6 functions (atoms), found by the MP procedure. Atoms 1-6 ?are shown in Figure 2.
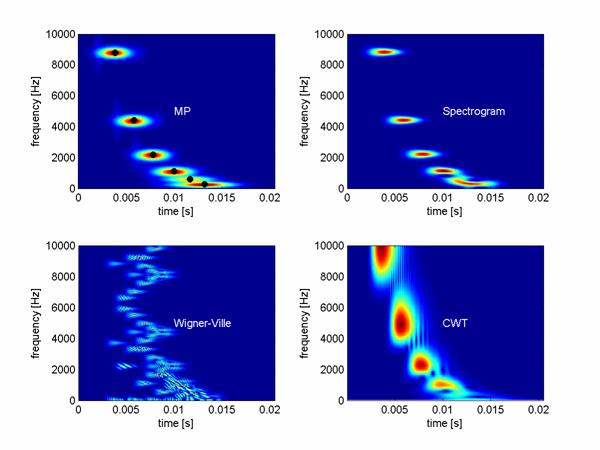
Since we know the parameters of the signal components, we can construct time-frequency distribution of the signal energy. In Fig. 2 the time-frequency distributions (t-f distributions), for the simulated signal consisting of 6 gammatones, found by different methods are shown. Spectrogram gave good results for components of distant frequencies, however it was unable to separate two lower frequency components. It is easy to observe the low frequency resolution of WT for high frequencies and poor time resolution for low frequencies. Wigner de Ville (W-V) method without corrections give very poor picture which can be improved by introduction of appropriate correction terms. However the procedure of improving W-V performance is always to some extent arbitrary, moreover W-V method does not provide parametric description of the signal. The same holds for the continuous WT and spectrogram. MP procedure is characterized by the highest resolution and even more important ? it provides the parametric description of the signal components.
Fig. 2. Time-frequency (t-f) distribution of energy density for simulated signal (shown in Fig. 1) approximated by different methods: MP, spectrogram, Wigner-Ville, continuous wavelet transform. Black points on the first plot indicate t-f centers of the fitted functions.
B. Results for experimental data
Tone and click evoked OAE were decomposed by means of the MP algorithm and the parameters of the components were found. In Fig. 3 an example of the decomposition of click evoked OAE is shown. The basic features of the OAE are reproduced by the first 15 atoms, which account for 95% of the energy of the signal. When the components of the signal are known it is straightforward to construct the time-frequency distribution of the energy density (Fig. 4).
Fig. 3. The MP decomposition of click evoked OAE. From top to the bottom: original signal, reconstruction from 20 functions, functions found by the MP algorithm.
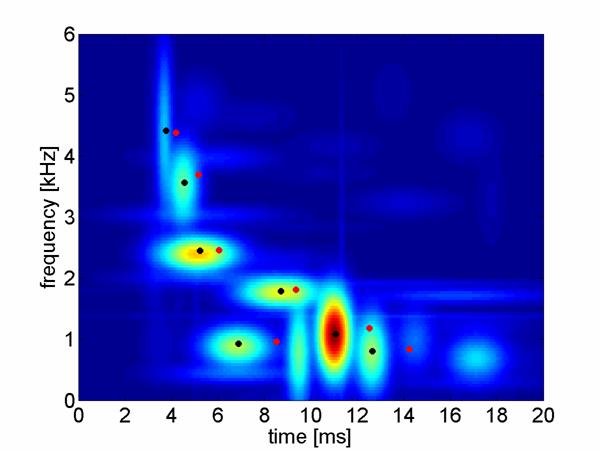
The sum of the tone evoked OAE corresponds quite well to the click OAE. In order to compare tone and click evoked OAE, on the Fig. 4 the centers of the atoms for click and tones evoked OAE are shown together. We can observe that the centers of tone evoked OAE tend to be shifted toward longer latencies. This might have been expected from the fact that the stimuli in the case of bursts were applied with some delays. We can conjecture that the click evoked response is the superposition of the tone responses, which indicates the linearity of the mechanisms for the applied level of stimuli.
Fig. 4. Time-frequency distribution of energy obtained by means of the MP decomposition of click evoked OAE. Black points indicate t-f centers of the main atoms of click evoked OAE. Red points mark the positions of the strongest atoms of responses to tone bursts.
The MP method provides directly the latencies and frequencies of the OAE components therefore construction of the latency-frequency dependence is straightforward. In case of tone-evoked OAE the positions of atoms not always corresponded exactly to the frequencies of stimulation, therefore the highest energy atoms occurring within ? 500 Hz band, in respect to the stimulation frequency, were used for the construction of the frequency-latency curve. For the click evoked OAE five highest energy atoms were selected. We have fitted different kinds of power law functions to represent at best the frequency-latency relationship for the click and tone evoked OAE. The best fit for tone evoked OAE was obtained for the function:
with parameters a =12.1 ms, b =-0.6237. Similar kind of fit was performed for click evoked OAE (Fig. 6). In this case the parameters of function given by Eq. (2) were: a =10.82 ms, b =-0.565. High time-frequency resolution of the presented method made possible the study of the relationship between the stimulus and the pattern of the time-frequency cochlear response. We have observed that the frequency of the tone stimulus is not exactly reproduced in OAE and the response depends on the individual features of the subject?s cochlea. Namely for each subject there are resonant modes at some privileged frequencies, which appear to bigger or lesser degree for different frequencies of the stimulus. An example of the effect is illustrated in Fig. 5.
Fig. 5. Time-frequency contour distributions of energy for OAE signal evoked by tone burst stimuli (from 1000 to 4000Hz). Frequency of the stimulation is given above the maps. Frequencies of atoms with similar t-f parameters, which appear for different stimulus frequencies, are written next to them (in Hz).
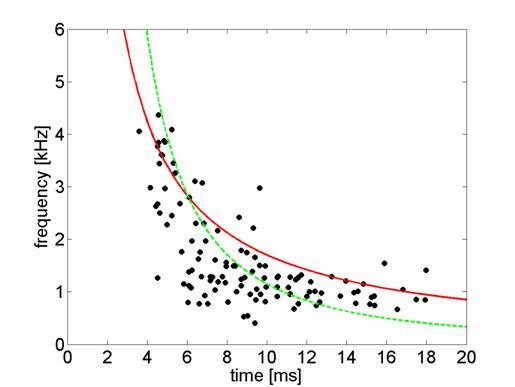
Fig.6. T-f centers of functions fitted by the MP algorithm to click evoked responses for all subjects. Five highest energy atoms of MP decomposition were selected. The curve is a power t=afb fit to the data with parameters a=10.82 ms, b =-0.565 (R-square: 0.4407). Dotted curve correspond to the 17/f relation suggested by Talmadge.
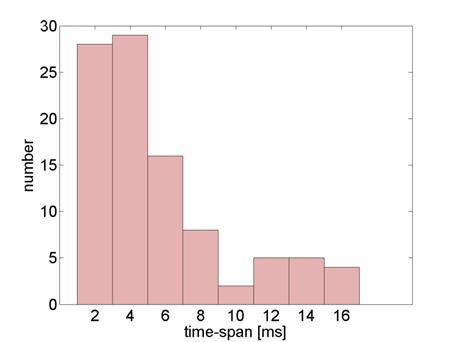
In Fig. 7 the histogram of the time spans of the resonant modes is shown. It has a bi-modal character. It seems that there are some short-time resonant modes and the long ? time resonant modes. One can postulate that the second ones might be connected with the spontaneous OAE.
Fig. 7. Histogram of the time spans of the atoms which can be considered as a resonant modes.
IV. DISCUSSION
The application of adaptive approximations by the MP algorithm allowed for identification of OAE intrinsic components, which eluded conventional methods of signal analysis. It was possible because of the high time-frequency resolution of the MP and the parametric description of the components. The time-frequency resolution of the MP method is superior to windowed Fourier transform or wavelet transform. Contrary to WT the MP method does not assume any arbitrary frequency bands. It does not require, as is the case for Wigner-Ville or Choi-Williams transforms, introduction of corrections connected with cross-terms, which is always to some extent subjective procedure. The property, which distinguishes MP from other methods, is the description of the components of a signal by means of parameters of the clear meaning, namely: their latencies, frequencies, time spans and energy (or amplitude). Usually most of the energy of the signal is described by a few components only. Comparison of t-f energy distributions for tone and click stimuli (for the level of stimuli applied in this study) revealed that the click evoked responses to the large extent correspond to the superposition of tone burst evoked responses, which indicates the similar mechanisms of the generation in both regimes of stimulation and a minor influence of the cochlear non-linearities. The observation that for different frequencies of stimulation the same preferred response frequencies appeared in OAE spectrum was made already by Elberling et al. (1985). However the Fourier method available at that time did not allow to obtain time-frequency characteristics of these preferred frequencies. By means of MP method it was found that the components of the OAE signal occur for different stimulation frequencies with the same frequency and latency. Therefore they can be considered as a resonant modes of the inner ear. Already in the early eighties the models were proposed with the aim of explaining the privileged frequencies in the OAE signals (e.g. Manley 1983, Sutton and Wilson 1983, Neely and Norton 1987), which assumed the presence of irregularities along the cochlear partition. Another theory put forward by Bell (2002) connects fine structure of OAE with existence of resonance cavities in cochlea. The MP method has a potential to become crucial tool in elucidation of the mechanisms operating in the cochlea and resolving controversies concerning the OAE generation. Superior time-frequency resolution of MP and quantification of the signal components in terms of physiologically meaningful parameters opens a new possibilities in confrontation of theory with experiment and binding different phenomena connected with otoacoustic emissions? e.g. spontaneous and evoked responses.?
REFERENCES Bell A. (2002). ?Musical ratios in geometrical spacing of outer hair cells in colchea: strings of an underwater piano?? Proc. of the Intern. Conference on Music Perception and Copgnition, Sydney, 2002. Eds.C. Stevens, D. Burnham, G. Mc pherson, E. Schubert, J. Renwick, Adelaide. http://www.auditorymodels.org/jba/PAPERS/AndrewBell/Bell_ICMPC7.pdf
Blinowska K.J., Durka. P.J. (1994). ?The Application of Wavelet Transform and Matching Pursuit to the Time-Varying EEG signals,? in Intelligent Engineering Systems through Artificial Neural Networks. Eds.: C.H. Dagli, B.R. Fernandez. ASME Press, New York, ISBN 0-7918-045-8, Vol.4. pp.535-540.
Blinowska K.J., Durka. P.J. (2001). ?Unbiased high resolution method of EEG analysis in time-frequency space,? Acta Neurobiologiae Experimentalis, vol. 61, pp. 157-174.
Durka P.J., Ircha D., Neuper Ch., Pfurtscheller G. (2001). ?Time-frequency microstructure of event-related EEG desynchronization (ERD) and synchroznization (ERS),? Medical & Biological Engineering & Computing, Vol. 39, No. 3, pp. 315-321.
Mallat, S. G., Zhang, Z., (1993). ?Matching pursuit with time-frequency dictionaries,? IEEE Trans. Sign. Process. 41, 3397-3415.
Manley, G. A. (1983). ?Frequency spacing og acoustic emissions: A possible explanation,? in Mechanisms of Hearing, edited by W. R. Webster and L. M. Aitkin (Monash U. P., Clayton, Australia), pp.36-39.
Neely, S. T., and Norton, S. J.,? (1987). ?Tone-burst-evoked otoacoustic emissions from normal-hearing subjects,?? J. Acoust. Soc. Am. 81, 1860-1872.
Shera, C.A., Guinan, Jr., J. J. (1999). ?Evoked otoacoustic emissions arise by two fundamentally different mechanisms: A taxonomy of mammalian OAEs,? J. Acoust. Soc. Am. 105, 782-798.
Sisto, R., Moleti, A., (2002). ?On the frequency dependence of the otoacoustic emission latency in hypoacoustic and normal ears,?? J. Acoust. Soc. Am. 111, 297-308.
Sutton, G. J., and Wilson, J. P. (1983). ?Modeling cochlear echoes: The influence of irregularities in frequency mapping on summed cochlear activity,? in Mechanics of Hearing, edited by E. de Boer and M. A. Viergever (Delft U. P., Delft, The Netherlands), pp. 83-90.
Talmadge, C.L., Tubis, A., Long G. R., Piskorski, P. (1998). ?Modeling otoacoustic emission and hearing threshold fine structures,?? J. Acoust. Soc. Am. 104, 1517-1543.
Talmadge, C.L., Tubis, A., Long G. R., Tong, C. (2000). ?Modeling the combined effects of basilar membrane nonlinearity and roughness on stimulus frequency otoacoustic emission fine structure,?? J. Acoust. Soc. Am. 108, 2911-2932.
Tognola, G., Grandori, F., and Ravazzani. P. (1997). "Time-frequency distributions of click-evoked otoacoustic emissions," Hear. Res. 106, 112-122.
Zweig, G., Shera, C.A., (1995). ?The origin of periodicity in the spectrum of evoked otoacoustic emissions,? J. Acoust. Soc. Am. 98, 2018-2047.
Zygierewicz J., Blinowska K.J., Durka P.J., Szelenberger W., Niemcewicz Sz., Androsiuk W. (1999). ?High resolution study of sleep spindles,? Clinical Neurophysiology 110 (12), pp. 2136-2147.
|
|||


 |
•
•
•
• Main
|
 |