 by Roger Thornton, PhD
|
RECORDING
CLICK-EVOKED OTOACOUSTIC EMISSIONS
ĀĀĀĀĀĀĀĀ USING MAXIMUM LENGTH SEQUENCES
(Summary
of Thornton et al., 1994)
ARD Thornton
MRC
Institute of Hearing Research, Royal
South Hants
Hospital
Southampton,
Hants, SO14
0YG
Telephone:
(023) 8063 7946, Facsimile: (023) 8082 5611
Email: ardt@soton.ac.uk
1.
INTRODUCTION
Neonatal
hearing screening, using evoked otoacoustic
emissions (EOAEs) would be improved if the testing
could be speeded up and made more sensitive to detect the small responses
that occur shortly after birth (Kennedy et al. 1998, Thornton 1999). It was
to address these two problems that the feasibility of applying maximum length
sequence (MLS) techniques to evoked emissions was investigated.Ā The duration of the evoked emission isĀ ofĀ
the order of 20 ms so if the speed of the technique is increased by
simply increasing the click presentation rate, the responses to successive
clicks will start to overlap each other at rates greater than about 50
clicks/s, the rate recommended by Kemp et al. (1990).Ā It would be impossible toĀ recover the normal, evoked emission
from these overlapped recordings.Ā
However, if a particular sequence of clicks and silences, known as a
maximum length sequence (MLS), is presented thenĀ the overlapped responses can be
deconvolved to give the original response that would have been obtained from
conventional, slow, averaging.Ā
Currently, such a technique has been applied to otoacoustic
emissions with click rates of up to 5000 clicks/s.
2.
MAXIMUM LENGTH SEQUENCES
ĀĀĀĀĀĀĀ
|
|
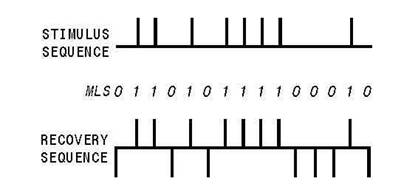
FIG.1
|
For
each stimulation sequence of 1s and 0s a recovery sequence
can be obtained by replacing each 0 in the stimulus sequence
with -1.Ā An MLS and
its recovery sequence are shown in Figure 1. Details of
MLS generation and deconvolution
have been published (Davies, 1966;Ā
BurkhardĀ et
al.,Ā 1990)
andĀ the first audiological
application ofĀ MLSĀ was given by Eysholdt
and Schreiner (1982).
|
|
One way of visualising the recovery process is shown in
Figure 2 using an MLS of length 3Ā comprising the stimulus
sequence 1, 1, 0; the corresponding recovery sequence beingĀ 1, 1, -1.Ā
To perform the recovery, the stimulus sequence isĀ rotated left by the minimum inter-stimulus
interval two times to complete the matrix shown on the left
hand side and is then multiplied by theĀ
recovery sequence.Ā
|
|
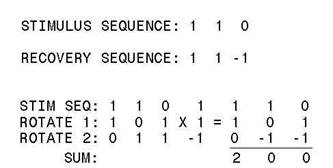
FIG. 2
|
When the right hand matrix, containing
the multiplied values, is summed theĀ ærecovered' stimulus is obtained at
twice its original amplitude (because the MLS stimulusĀ sequence had two clicks in it) with all other,
later elements being cancelled to zero.Ā
In order to improve the signal-to-noise ratio
(SNR), time domain averaging is carried out as normal, withĀ analogue-to-digital converter (ADC)
samples for corresponding points in consecutiveĀ presentations of the MLS being summed.Ā For the MLS recovery process to work, there must be no gap between the deconvolved MLSs that will be added to the average.
|
|
This means that there must be
no additional delay between ADC samples when the presentation of oneĀ MLS finishes
and the next begins; the time between samples being typically of the order of
30 Ąs.
In conventional
averaging, the normal way of rejecting records that are too noisy is to have
a reject level criterion that comes into effect when the click stimulus has
passed.Ā The problem with MLS
recordings, particularly at the higher rates, is that the click stimuli and
emission responsesĀ
overlap, with the responses 'riding on top' of the stimuli and
so it is simply not possible to properly reject noisy response epochs with
such MLS stimuli.Ā
3.
"ON-THE-FLY RECOVERY"
To overcome this problem a
procedure has been developed and named "on-the-fly recovery." Instead
of adding each incoming ADC sample to a summation buffer the new method
multiplies each sample as it arrives by the values in the recovery sequence
and adds the results directly into the appropriate positions in a recovery
buffer.Ā As soon as the last sample for
one MLS has been dealt with, the recovery buffer contains the recovered
response from all the stimuli in that MLS. By using double-buffering, each
recovered response can be checked against the rejection criteria and accepted
or rejected while the response to the next presentation of the MLS builds up
in a second buffer; accepted responses are added to a final summation
buffer.Ā
|
|
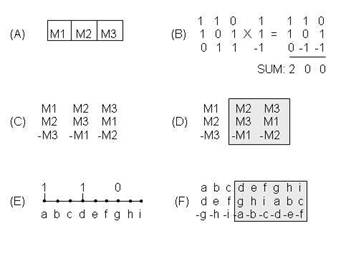
FIG.3
|
Consider an MLS
of length 3 with stimulus sequence 1, 1, 0.Ā
The 3 slices of the MLS are represented by M1, M2
and M3 (Figure 3[A]).Ā
The recovery process, seen before, is illustrated
again in Figure 3[B] and, in terms of the slices, in Figure
3[C].
An additional benefit
of the "on-the-fly recovery" method is that it
can recover only those parts of the MLS that are of interest.Ā The set of recovery sequence points to be
used will change as one works through the MLS, but in a
systematic way, so that finding the correct set is computationally
simple.Ā This method allows the recovery window to
be positioned anywhere within the duration of the MLS provided
that the edges of the window correspond to points in the
MLS; that is when a stimulus opportunity of either a click
or a silence is occurring.Ā This is illustrated in Figure 3[D].
|
|
Recovery windows starting and
ending at intervening points can obviously be achieved by
rounding up the actual recovery window used to a whole number
of MLS points and then subsequently discarding the unwanted
portions. Figure 3[E] illustrates the recovery procedure
using the ADC samples which are labelled a to i.Ā The position of each sample in the final buffer
is shown in Figure 3[F].
ĀĀĀĀĀĀĀ
Since the small
response overlaps and rides on top of the large click stimuli,
a large dynamic range and good linearity are needed for
MLS systems (Thornton,
1993b).Ā The
dynamic range needed has been estimated as 94dB (Thornton
et al., 1994).Ā Noise in the system is the limitation of the
SNR and there are three noise sources identified so far
:-
1.
Random noise from the microphone, amplifiers and ADC
quantisation.Ā The largest contribution
to the noise component is from the microphone.Ā Our system has at best about a 70 dB
signal to noise ratio so, in the raw input signal, the EOAE is only
approximately 20 dB above the noise floor.Ā
However because these sources of noise are random they are reduced by
averaging, the standard formula of 10.log (n) dB improvement in SNR occurs
for nĀ averages.Ā Furthermore, if this noise is less than the
noise from the test room and from subject or patient movement, then it will
have little or no effect on the averaged waveform.
2.
Noise due to non-linearities
in the system.Ā If the system is driven
into a non-linear region of operation, the reconstructed waveform will have
noise that is produced as a result of that non-linearity and since it is
synchronised to the clicks, it will not be reduced by averaging.Ā Thus all distortion products should be less
than the required 94 dB.
3.
Noise due to incomplete cancellation.Ā As explained above, the MLS technique works
on the basis of cancellation, i.e. when one click waveform is subtracted from
another, the result must be exactly zero.Ā
If the clicks differ by only 1%, a 0.5% residual (the difference
between each click and the mean click) would be left, giving a dynamic range
of only 46 dB.Ā It is therefore very
important that the clicks are matched precisely in both time and
amplitude.Ā Non-random variations of
click amplitude will not be reduced by averaging.
5.ĀĀ SYSTEM DYNAMIC RANGE AND LINEARITY
|
|
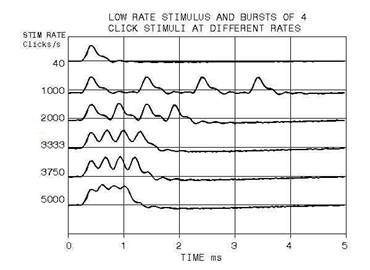
FIG. 4
|
At high stimulus
rates the stimuli become very close to each other. At 3000
clicks/s they are beginning to overlap each other.Ā
At 5000 clicks/s the overlap is considerable.Ā
This can be seen in Figure 4 which shows stimuli
generated in an IEC 2 cc cavity in which a B&K microphone
was mounted to record the signal.Ā
The 5000 clicks/s stimulation rate does not
look anything like a train of clicks as the stimuli have
very nearly merged together.Ā
However, there are two points of note.Ā
Firstly the ear, as will be
shown later, appears to respond to this as a set of clicks presented at a
rate of 5000/s.Ā Secondly the deconvolution procedure works for both
the stimulus as well as the response and this fact enables us to check
our Institute's in-house MLS system to see if any non-linearities
have altered the clicks and caused interaction between the stimuli.
|
|
|
|
|
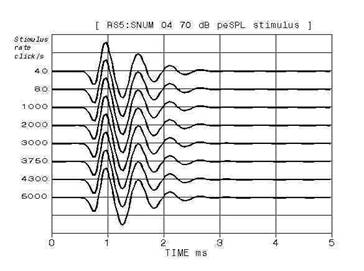
FIG. 5
|
FigureĀ
5 shows the deconvolved click stimuli,
albeit recorded through the system's 500 to 5000 Hz
bandpass filter and therefore
broadened somewhat, obtained at rates from 40 to 5000 clicks/s.Ā
There appears to be very little difference between
the conventional click at 40/s and the MLS clicks that follow.Ā
|
|
|
|
|
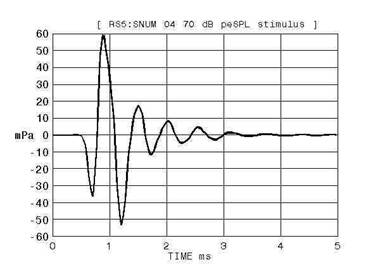
FIG. 6
|
Figure 6 shows the same
data with the separation between click waveforms reduced
to zero.Ā This enables the fine detail of the structural
changes to be seen and it is clear that such differences
as there are can be seen only as a slight increase in the
line width that occurs from about 1.5 ms onwards.Ā
The initial part of the click waveform, the one probably
responsible for generating the EOAE, varies virtually not
at all over stimulus rate.Ā
This indicates that both the
dynamic range of the recording system and its linearity are good enough if
the stimuli can be deconvolved to this degree of accuracy.Ā
|
|
|
|
|
5.
RESULTS
|
|
|
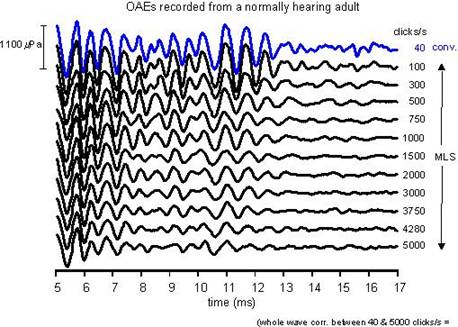
Ā Figure
7 shows the waveforms for evoked emissions recorded
conventionally and with the MLS technique at stimulus rates
up to 5000 clicks/s. It can be seen that there is a decrease
in the long latency, low frequency portion of the OAE waveform
as stimulus rate increases.Ā
This rate effect and other normative properties have
been detailed elsewhere (Hine
and Thornton, 1997).Ā
Happily, for applications in neonatal screening,
the short latency, high frequency part of the emission is
much less altered by this rate effect.
|
|
The responses recorded at stimulus rates
for which the clicks are clear distinct events, do not show
any major changes from the responses recorded at the highest
rates for which the clicks merged together.Ā
Thus, as mentioned earlier, the auditory system appears
to be responding to the æmergedÆ clicks in the same way
as it does to the ædistinctÆ ones.Ā
The technique has also been used to investigate pathological
conditions (Hine
et al, 1997; Norman et al, 1996) and applied
to neonates (Slaven and Thornton,
1998).
There are applications to neonatal
screening because, for neonates with good OAEs,
the MLS technique can pass the baby some 13 times faster
than the conventional technique.Ā
However, the most important aspect of using MLSs
is that, if averaging is done for the same time as the conventional
technique, then responses can be detected that are only
20% of the amplitude of those that would be detected by
the conventional response (Hine
et al., 2001).Ā
Given the small responses obtained on Day 1 of a
neonateÆs life this could be important in the future.
There
are other areas of investigation which the MLS technique
makes possible particularly those involving recording the
non-linear temporal interaction responses generated by the
cochlea (Thornton, 1997; Thornton
et al, 2001).Ā Our current work indicates that these non-linear
components may be more sensitive to pathology than the conventional
ones.
REFERENCES
Burkard
R, Shi Y, Hecox KE.Ā
Brainstem auditory evoked responses elicitedĀ by maximum length sequences; EffectsĀ
ofĀ simultaneous masking noise.Ā J Acoust Soc AmĀ 1990; 87: 1656-64.
DaviesĀ
WDT.ĀĀ
GenerationĀ andĀ propertiesĀ
ofĀ maximumĀĀ length sequences.Ā Control 1966; 10: 364-5.
Eyesholdt
U, Schreiner C .Ā
Maximum length sequences ¢ a fast method for measuring
brainstem evoked responses.Ā Audiology 1982; 21: 242-50.
Hine
, J.E. and Thornton,
A.R.D. Transient evoked otoacoustic
emissions recorded using maximum length sequences as a function
of stimulus rate and level.Ā
Ear and Hearing, 1997, 18, 121-128.
Hine
JE, Thornton ARD, Brookes GB.Ā
Effect of olivocochlear
bundle section on evoked otoacoustic emissions recorded using maximum length sequences.Ā
Hearing Research 1997; 108:28-36.
Hine
JE, Ho CT,
Slaven A, Thornton ARD.Ā Comparison of transient evoked otoacoustic emission thresholds recorded conventionally
and using maximum length sequences.Ā
Hearing Research 2001; 156:104-14.
KempĀ
DT,Ā
RyanĀ S, Bray P.Ā
A guide toĀ
theĀ effectiveĀ useĀ of
otoacoustic emissions.Ā Ear Hear 1990; 11: 93-105.
Kennedy
CR, Kimm L, Cafarelli
Dees D, Campbell MJ, Thornton ARD.Ā
A controlled trial of universal neonatal screening
for early identification of permanent childhood hearing
impairment.Ā The Lancet 1998; 352: 1957-64.
Norman
M, Thornton ARD, Slaven A, Phillips AJ.Ā
Otoacoustic emissions recorded
at high rates in patients with confirmed acoustic neuromas.Ā American Journal of Otology 1996; 17:763-72.
Slaven,
A and Thornton, ARD.Ā
Neonatal otoacoustic emissions recorded using maximum length seguence stimuli.Ā Ear
& Hearing 1998; 19(2): 103-110.
Thornton
ARD.Ā High
rate otoacoustic emissions.Ā J Acoust Soc Am
1993; 94: 132-6.
Thornton
ARD, Folkard TJ, Chambers JD.Ā Technical aspects of recording
evoked otoacoustic emissions using
maximum length sequences. Scandinavian Audiology 1994; 23:
225-31.
Thornton
ARD.Ā Maximum length
sequences and Volterra series
in the analysis of transient evoked otoacoustic
emissions.Ā British
Journal of Audiology 1997; 31:493-8.
Thornton
ARD.Ā Maturation
of click evoked otoacoustic emissions
in the first few days of life. In: Grandori
F, Collet L, Ravazzani
P, editors. Otoacoustic Emissions
from Maturation to Ageing. Series in Audiology Number 1.
London: Decker
Europe ; 1999. p. 21-32.
Thornton
ARD.Ā Temporal
non-linearities of the cochlear
amplifier revealed by maximum length sequence stimulation.Ā Clinical Neurophysiology 2001; 112: 768-777.
|
|
|
|
|
|
|
|
|
|


