5. Frequency
Lets try to define a term which we can call as the "frequency component". But first few words about "frequency". The frequency is just reciprocal of the time length of the signal period - this fragment of the waveform which regularly repeats in the signal. Not all signals are periodic, which means that we cannot characterize all signals with frequency. To extend our consideration we will define a class of signals with variable frequency, where the period changes more or less systematically in time. The most popular example of such signal is what we call a "chirp" showed in the Figure 1. Although the amplitude and frequency of the chirp change in time, for this signal we can attribute values of amplitude and frequency. The simplest case of frequency component is the sinusoidal tone. However a waveform of similarly constant frequency and amplitude but not sinusoidal shape is for us a composed signal with harmonics. In turn, each harmonic having frequency being an integer multiplication of a fundamental frequency belongs to the class of frequency components.
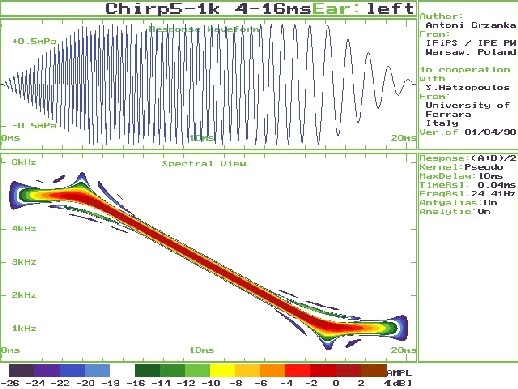
Figure 1: TF representation of a Chirp signal
Now we have a couple of terms which will allow us to determine the objective of time-frequency (TF) analysis. The goal of TF methods is to provide a picture of the signal as a set of frequency components. For each frequency component, we are interested in the evaluation of its amplitude and frequency variations. We assume that a particular frequency component may derived from a particular source or may be a harmonic So, we believe that performing a TF analysis of a signal like a TEOAE we are getting information about the sources or emission generators of the signal.
The result of the TF analysis has a form where signal intensities are mapped on the plane in time and frequency coordinates. In theory we have a lot of variants of methods dedicated for TF analysis. However, the spectrogram called Short Term Fourier Transform (STFT) is the most popular and natural method introduced by Gabor. The distribution is created using traditional spectral analysis for sliding, short segments of the signal. For successive time instants, a segment of the signal is gated around a given point in the time scale. The spectrum calculated for this time instant shows how power is distributed over frequencies. The time scale is scanned by sliding the gating window.
The STFT approach is very natural and has good physical interpretation. Unfortunately, the STFT gives results with low resolution. The time resolution is determined by the width of the sliding window and the obtained spectrum is averaged for the time period of "gated" segment. On the other hand, if one shortens the segment in order to increase the time resolution, he would lose frequency resolution. The uncertainty rule says that frequency resolution is reciprocal of the time resolution and vice versa. For such short signal as a TEOAE, dividing it into shorter segments results in very smeared image of the energy distribution.
A distribution using the wavelet transform offers the possibility to get such image that time resolution is higher for high frequency components and lower for low frequency components. Generally like in spectrograms, however, the similar trade-off both domains exists here.
We can increase the resolution two times by applying the so-called Wigner-Ville distribution (WVD). The "cost" of WND generating such over-natural effect consists in that false components, called cross-terms, appear in the image. Additionally, the values of the energy distribution is not positive everywhere, and this introduces difficulties in the interpretation of results.A typical TF represenation from a pre-term neonate is shown in Figure 2, generated with a custom-made software package, which will be soon be available in the OAE Portal site .
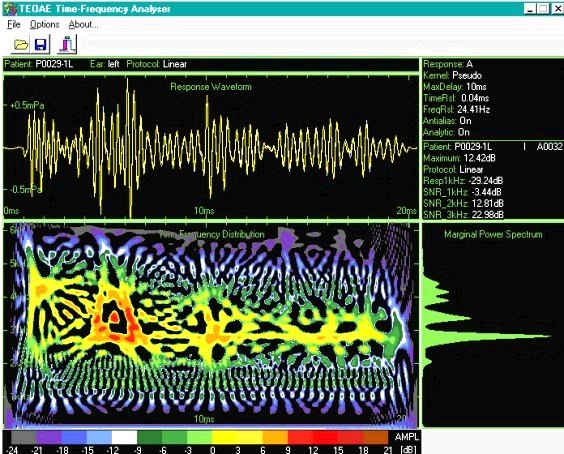
Figure 2: TF represenation of a TEOAE response, showing a large number of cross-terms
Various methods of smoothing have been proposed in order to lessen the effect of cross-terms. This concept has lead to the Cohen class of smoothing distributions. In this family, the most prominent position is taken by the exponential distribution named as Choi-Williams.
The majority of studies which have used time-frequency analyses have pointed out that each class of signals requires an optimal selection of a specific distribution, which yields optimal results for that class of signal. The first reason is the necessity to select the resolution to fit the particular characteristics of the studied signal. The most fundamental reason is that a given "waveform" may have more than one time-frequency representations. For example, a signal with variable amplitude and constant frequency may be interpreted (and generated) as a signal with amplitude modulation, or as the superposition of two tones with close frequency and constant amplitudes. The same waveform may be generated one way or another and one distribution may give an image consistent with the first generator and another distribution may be consistent with other one. The usefulness of a particular method of analysis depends on that how well it matches the original signal.
6. TEOAEs and TF analyses
For TEOAE TF analysis I personally prefer to use the Wigner-Ville method modified with a specially fitted technique of regional smoothing. The method does not belong to the Cohen class of distributions because the smoothing is applied selectively to (a) regions where the energy is negative and (b) to the borders of such negative energy contours. With this method we can obtain significant improvements in the quality of the results, without losing significant portions of resolution. We know also the disadvantages of such an approach. When the cross-terms are located on the same places as the real components, the smoothing is not efficient enough to emphasize such information. Generally, though the smoother WVD method gives good results for the TEOAE signals.
An example of the Wigner-Ville distribution with regional smoothing is shown in Figure 3.
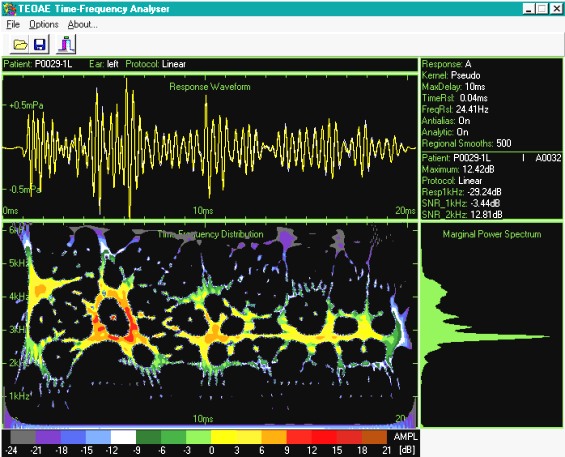
Figure 3: The TF representation of Figure 2, smoothed 500 times
Data from a recent study we have conducted on neonatal subjects have indicated that on the time-frequency plane one can distinguish several categories of components, such as:
- Horizontal lines with almost constant frequencies
- Almost vertical lines covering broad band of frequencies and short time period
- Lines with decreasing (falling) frequencies.
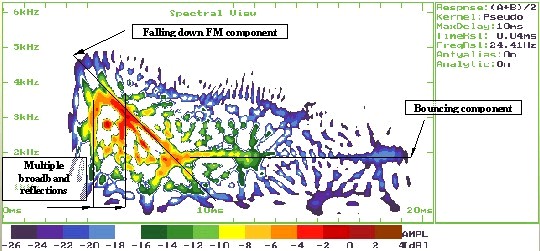
Figure 4: Various types of TEOAE components in a TF representation
Our interpretation of these results leads to the conclusion that every component category might be generated by a different cochlear mechanism. The horizontal lines are related to spontaneous emission. We have observed that the dominant frequencies of these lines overlap with the peak frequencies of the spectrum of spontaneous emissions. We suspect that the vertical lines are traces of the acoustic artifact the click produced by stimulus reflections. We have not clear explanations yet, about the decreasing frequency-components. We hypothesize that these component could reflect distortion product otoacoustic emissions, an argument which needs additional investigations.


